
Design of a medical-financial dashboard for Health Insurance Providers, focused on querying, comparing, and analyzing high-cost medication prices.
Project
Case Study
Timeline
5 days
Role
Product Designer
Year
2025
The Problem
What Wasn’t Working
Health insurance providers need to make decisions regarding high-cost medications, but price information is scattered, with variations in strength, formulation, and dates, making reliable comparison and analysis difficult.
High-cost medication prices vary by provider, formulation, strength, and time.
Information is often fragmented, outdated, or hard to compare.
Critical decisions are made with poor data visibility.
Pain Points
Non-standardized data
Manual comparisons
Lack of traceability
Risk of misinterpretation
Why does it matter?
High-cost medications represent one of the largest expenses for health insurance providers. Having clear and comparable information is crucial for making better decisions and generating meaningful savings at an institutional level.
The Design Challenge
Design a dashboard capable of presenting complex and not always standardized data, without oversimplifying or leading to misinterpretation.
Objectives of the Design
Enable quick price lookup
Allow clear comparisons between health insurance providers
Transparently show variations
Analyze price trends over time
Build trust in the data
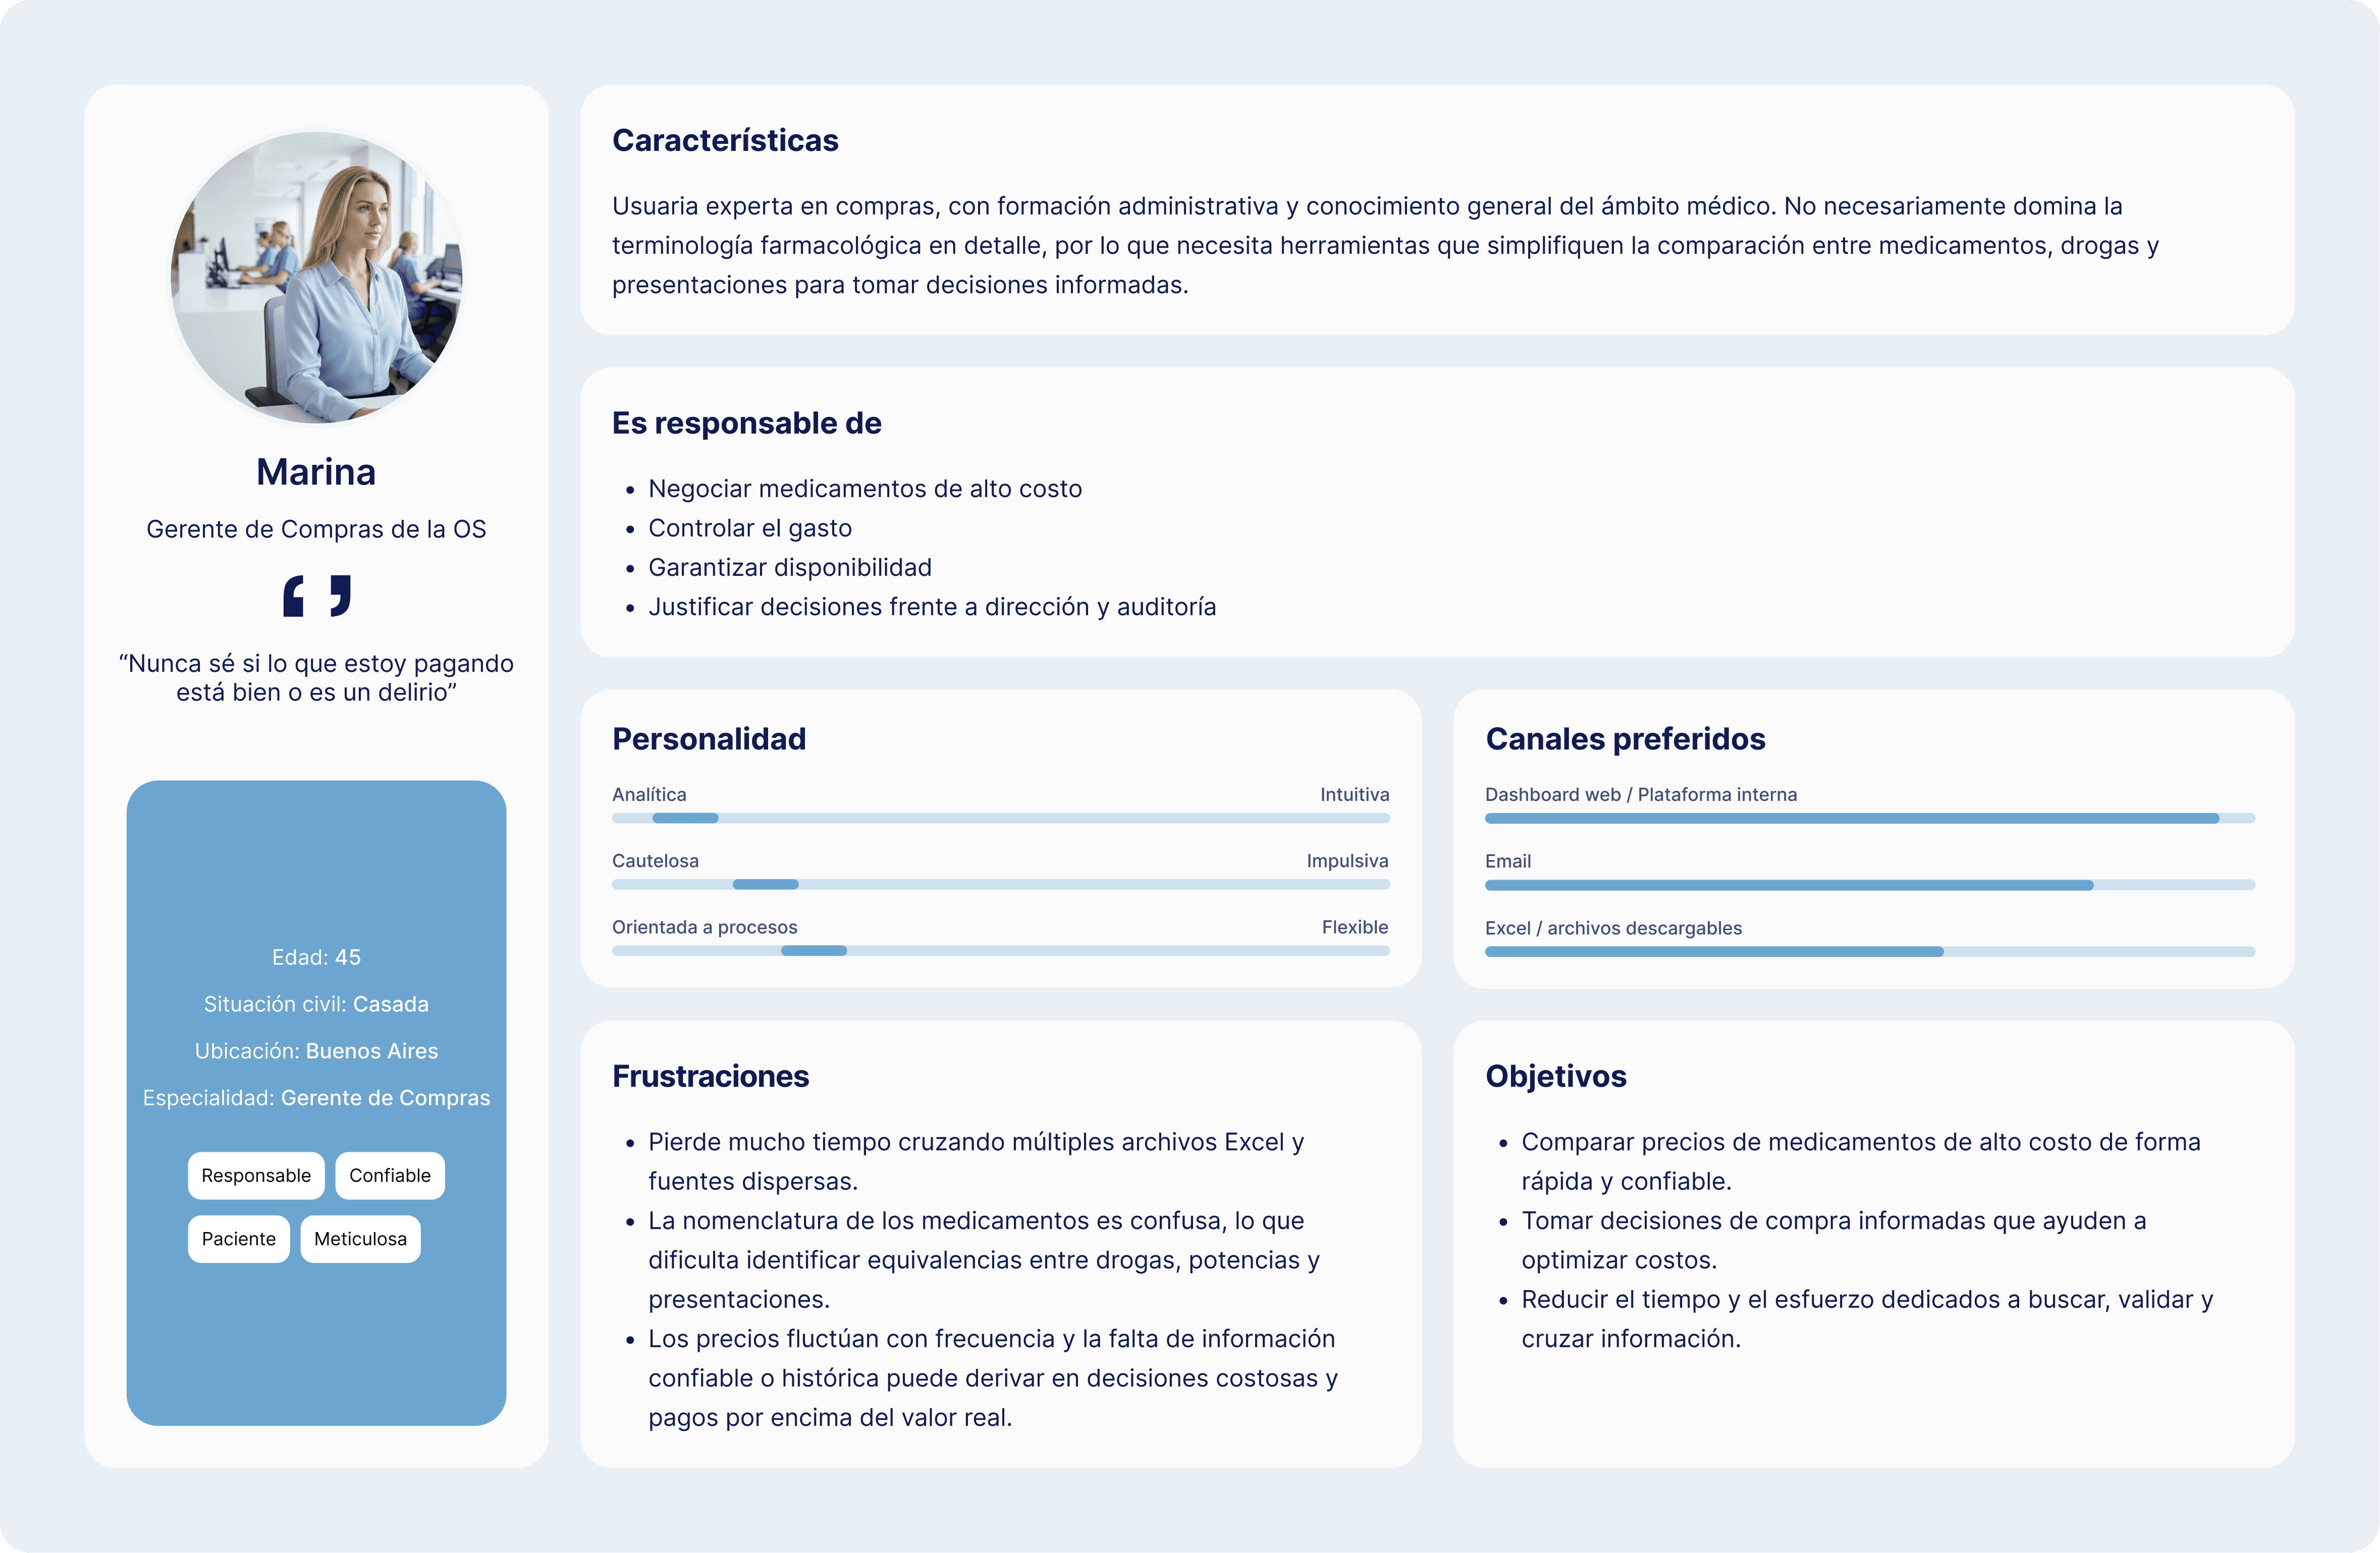
Research
In platforms like this, it’s common to have different users with complementary responsibilities, often using the system sporadically at specific times of the month. This requires a clear interface that allows users to understand and interact with the information quickly.
During research, gaining knowledge of the healthcare domain was crucial, especially regarding high-cost medications: drug types, strengths, formulations, and sector-specific terminology. Understanding this classification allowed the interface to align with the users’ real language, making it easier to search for and compare information.
As a reference, financial dashboards and analytics tools were analyzed, along with modern B2B products that prioritize clarity, visual hierarchy, and ease of use—taking Stripe as a benchmark for best practices in complex interfaces.


As is (current situation)
Today, querying and comparing high-cost medication prices is done manually and in a fragmented way, creating operational friction and leading to poorly informed decisions.
Problem:
Reliance on emails and phone calls.
The process is time-consuming, dependent on third-party availability, and lacks automation.
02
Problem:
Isolated Excel files and informal searches.
Details:
Information comes in disparate formats or from online sources without guaranteed updates or validity.
03
Problem:
Fragmented and hidden data.
Details:
Information is shared partially due to individual agreements, preventing a comprehensive view of the market.
Problem:
Difficulty comparing actual values.
Details:
Each health insurance provider negotiates independently, making it impossible to establish a standard "market price."
05
Lack of Traceability
Problem:
Lack of historical context and data origin.
Details:
It is unclear how or when the data was obtained, and there is no history to analyze price trends.
06
Problem:
Risk in decision-making.
Details:
Incomplete information directly impacts costs, planning, and increases financial risk.
Primary Job
When I need to acquire or renegotiate a high-cost medication,
I want to quickly understand how its prices behave in the market and across other health insurance providers,
so I can make informed purchasing decisions, negotiate more effectively, and justify expenses confidently.
Compare Prices
When evaluating a specific medication,
I want to compare its price across different health insurance providers and suppliers,
so I can identify overpricing and negotiation opportunities.
Analyze Price Variations Over Time
When reviewing medication expenses,
I want to see how prices have evolved over time,
so I can anticipate increases and plan the budget effectively.
Understand Product Variations
When reviewing medication expenses,
I want to see how prices vary by formulation, strength, and presentation,
so I can understand differences between products and make informed decisions.
Validate Data Reliability
When reviewing medication information,
I want to verify the accuracy and source of the data,
so I can trust it for decision-making and reduce the risk of errors.
Justify Subsequent Decisions
When closing a negotiation or selecting a supplier,
I want to have clear and traceable information,
so I can explain and defend my decision to management.
Maintain Control and Predictability
When managing the annual budget,
I want to anticipate potential price increases,
so I can prevent unexpected deviations.
Avoid Internal Conflicts
When costs are questioned,
I want to have clear and objective data,
so I can align the audit, procurement, and management teams.
Support Decisions with External Stakeholders
When a health insurance provider is audited or benchmarked,
I want to show that the paid prices are aligned with the market,
so I can protect the institution.
Rather than designing isolated screens, these Jobs To Be Done served as a conceptual framework that was later translated into concrete UX and product decisions.
For the Purchasing Manager, comparing prices is not just about “seeing values,” but about validating decisions with high economic and political impact within the organization.
Design Implications
The interface must prioritize clear, justifiable, and auditable comparisons, not just price listings.
The lack of data standardization is known and accepted by users.
Users understand that data may vary in strength, formulation, or entry, and they don’t expect perfection—but they do expect transparency.
Design Implications
Instead of hiding inconsistencies, the design should make them visible and understandable, reducing the risk of misinterpretation.
Users make complex decisions under time pressure, which increases the risk of errors if information is not well organized and prioritized.
Design Implications
It is crucial to reduce cognitive friction through:
Guided searches
Clear visual hierarchy
Highlighted insights
A price without context (date, source, variation) is neither useful nor defensible for users.
Design Implications
Each value should be presented with clear traceability, reinforcing confidence and institutional backing for decisions.
These insights guided the design decisions and served as the foundation for the solutions proposed in the following sections.
Clarity Over Simplicity
The design must prioritize accurate understanding of information, even if it means showing greater complexity, avoiding oversimplifications that could lead to errors.
Why:
In high-stakes financial decisions, an interface that is “too simple” can be dangerous.
Data Transparency
Explicit Comparability
The interface must enable clear comparisons between health insurance providers, products, and time periods, highlighting relevant differences without requiring manual calculations.
Why:
Comparison is the user’s primary job, not a secondary feature.
Reduce Cognitive Load
The design should guide users through complex workflows using visual hierarchy, progressive search, and clear feedback.
Why:
Users work under time pressure and carry high responsibility.
Decision Support, Not Just Visualization
Each view should answer a specific user question and provide actionable information, not just display data.
Why:
The product’s value lies in enabling decisions, not in showing tables.
Consistency and Scalability
The system must maintain consistent patterns and be able to scale with new features without breaking the experience.
Why:
It is an enterprise product with long-term evolution.
The design criteria allowed us to evaluate different alternatives and guide the definition of wireframes, prioritizing solutions that best addressed the identified Jobs To Be Done.
User Flows and Information Architecture
Before defining the information architecture, the most representative user flows of the product were identified and mapped.
These user flows helped understand how users make decisions, which steps are critical, and where friction might arise, serving as the foundation for structuring the system coherently.
Solution
Job to be Done
When evaluating a specific medication,
I want to compare its price across different health insurance providers and suppliers,
so I can identify overpricing and negotiation opportunities.

Outcomes
Design Impact
Reduced time for data lookup
Fewer interpretation errors
Greater visibility of price variations
Improved support for strategic decisions
Increased trust in the data
Key learnings
Takeaways from the Project
Designing for complex domains requires showing, not hiding, uncertainty
Clarity is more important than simplicity
Design has a direct impact on business decisions
Next steps
Automatic alerts for atypical variations
Report export functionality
Historical benchmarking across health insurance providers
Role-based personalization
